How to Build Data Analyst Portfolio Projects That Will Get You Hired
One of my biggest struggles once I learned the basics of Data Analysis, was figuring out what kind of projects to build!
Everyone tells you to build good projects, but no one tells you what that means, or how to get started doing it.
In this post I’ll walk you through the process of building a good project and what that actually means, so you can build your own unique projects… not just cookie cutters of other people’s work.
But first, what’s the point of a portfolio project?
The “Why” of Portfolio Projects
Caution: Do NOT skip this section.
I know you’re eager to jump right into project ideas, but this is important.
Too many entry level data professionals don’t understand why they’re building a project in the first place… they’re just checking a box.
In turn, most people end up doing the Titanic Dataset, or building the 1 millionth Covid Dashboard (I was guilty of this 😂 ), and the recruiter/ hiring manager will immediately lose interest.
So what makes a good portfolio project?
It comes down to two things.
1. It demonstrates your technical skills
A good project shows your basic technical skills. It should showcase your ability to use SQL, Excel, Tableau, Python, or whatever tools you’re demonstrating.
Because if you don’t have work experience, then a project is the next best way to prove to an employer that you actually have the skills you put on your resume.
That being said, you don’t have to build a complete machine learning model or anything crazy.
Show that you are comfortable with the basics, and have a foundation to build on.
2. It shows you can think like a Data Analyst
This is so important… arguably more important than number one.
Look, anyone can follow a video and build a dashboard… Literally anyone.
I’m not saying that to be mean, but to reinforce that what makes us valuable as data professionals is not technical skills… it’s the way we think.
The data analyst mindset is inquisitive, problem solving, and looks at things from a business perspective.
A good project shows that you have this mindset. That you understand what questions to ask, how to find answers to those questions, and how to showcase them in a way that’s pleasing to stakeholders.
So while an analysis of every type of Pokémon sounds cool… it tells a business NOTHING of your understanding of real world data. You want your projects to be as close to a real world scenario as possible.
How to build the perfect project
Now we get into the good stuff. I’m going to cover where to find your datasets, how to structure your projects, some ideas for what kind of questions to solve during your analysis, and even some tips for where to host your projects… buckle up, it’s gonna be a wild ride!

Step One: Finding the Data
The first thing you have to do is find a good dataset, as that will be the foundation of your entire project.
Here are some of my favorite resources for finding free datasets:
Kaggle: https://www.kaggle.com/datasets
Data.gov: https://data.gov/
The World Bank: https://data.worldbank.org/
All of these are reputable sources with real world data.
As I said above, a Pokémon or a video game dataset might seem fun, and some recruiters might like it, but I think real world data is better.
Pro tip? Choose a dataset that matches the kind of work you want to do.
If you want to be a financial analyst, do a banking dataset. Wanna be a business analyst? Find a company dataset. A sports analyst? Do a sports dataset.
When in doubt, try to choose a dataset that is as close to real world as possible.
Step Two: Set the scenario
Before you begin analyzing your data, create a scenario as if you’re completing a case study.
I think this adds creativity to the project, and shows again that you understand a business’s needs.
So if I were to choose a credit card dataset, I would create a fake scenario, and write it out at the top of my case study/ project… something like:
“The stakeholders at Imaginary Bank have just acquired a dataset on the top credit cards in the U.S, and have tasked me with analyzing the data. They would like to know what cards are used most frequently, what spending category people spend most on (travel, food, entertainment, etc.), and what months have the most spending.”
Depending on your dataset, that write up will change, but the point remains the same; you want to show that if they gave you data and a set of instructions, you can get the job done.
Step Three: EDA
Now that you have your data, and you’ve set a scenario, it’s time to get down to business!
How you personally approach your EDA (exploratory data analysis) is up to you, but it should at a minimum show that you know how to;
Clean Data
Organize the data
Query the data
Draw insights from your research
Depending on the size of your dataset, you might consider using Excel or python to clean it, and then do a write up on the changes;
For example,
“Data Cleaning Steps: Converted ‘Spending’ column from string to number format. Removed trailing spaces in ‘Name’ column.”
This shows that you understand that data isn’t always clean, and that in order to do a proper analysis, you have to focus on data usability first.
This is also the time to show off all your SQL skills. Demonstrate these skills at a minimum:
Basic SELECT queries and WHERE clause filtering.
Aggregate functions (SUM, AVG, COUNT)
GROUP BY/ HAVING
JOINS (Left, Inner, Union, etc.)
Subqueries
VIEWS (not necessary, but a cool addition)
Once you’ve completed your write up, and you’ve answered all the questions from your scenario, it’s time to move on to visualizing!

Step Four: Visualize Your Data
I won’t drone on about visualizing, because quite frankly I’m no expert on it.
I don’t visualize much if at all in my current role, and I’m not gonna sit here and pretend I do.
But I will say this; keep your visualizations simple, organized, and business relevant.
Ask yourself, “What questions would my stakeholders want answered at a glance?”
Focus on the questions from the scenario you created.
For our example that could mean making a visualization that shows the top cards, top spending categories, and top spending months.
Also, consider adding filters to your dashboard. So they can see exactly how much is spent on a given month, or using a specific credit card, etc.
Visualization can be as much art as it is science, but don’t think your dashboard has to be aesthetically perfect. What’s most important is that it easily conveys information to your audience.
Step Five: Host your project
Phew! That was tough.
If you’ve made it to this step, congrats.
Now that your project is completed, it’s time to host it so recruiters and hiring managers can see it… but how do you do that?
Again, there are a ton of options here, but this is what I did.
Take your SQL code, and add it your Github. This should contain all the queries that you used for analysis, (and make sure to comment your code!)
Upload your Dashboard to Tableau Public. (It’s free)
Put the project, (with links to both your code and the dashboard), on your resume and LinkedIn.
Bonus Step:
I had my projects as case studies on my website, which made them easy to follow, and let me demonstrate all my steps in order. Unfortunately that website is no longer live, but a great example of what I mean can be found here https://medium.com/@yanhann10/in-pursuit-of-happiness-part-ii-e471a54f294e
You can see that she demonstrates her projects in a blog format that tells a story, and best of all? She used medium! So no paying for hosting, or trying to build a whole website just to show off your projects.
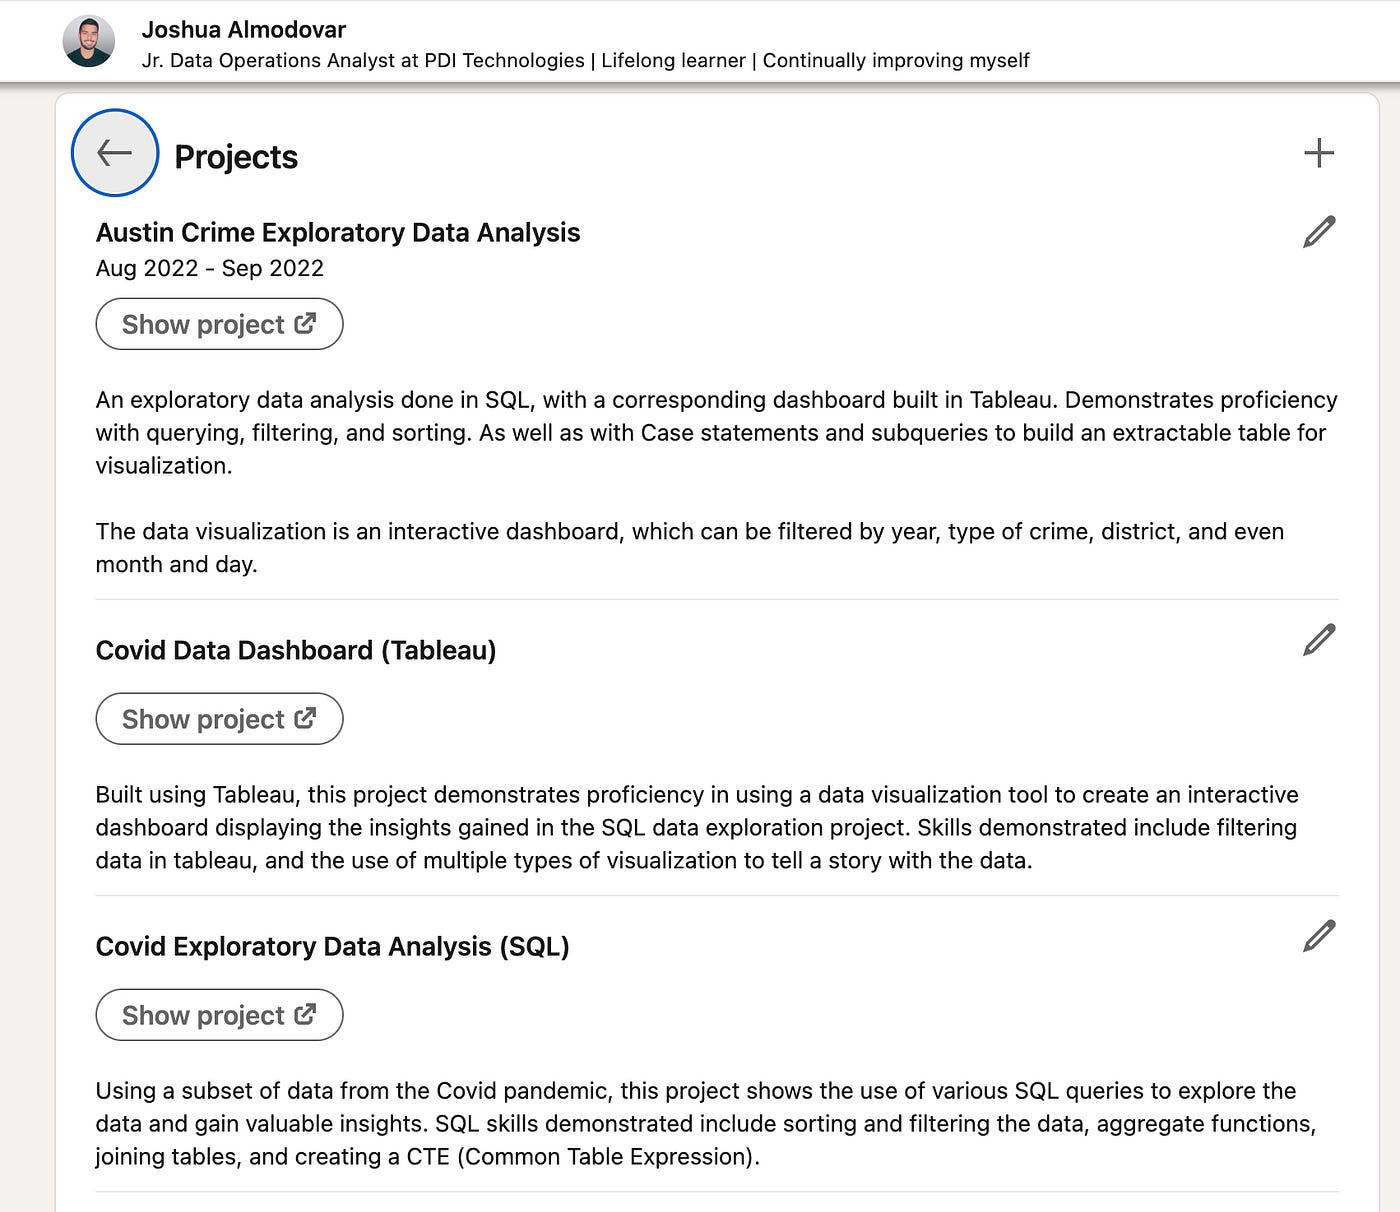
Here’s how I display my projects on LinkedIn
I haven’t added any of my recent projects to LinkedIn, but even my old projects give an example of what I mean.
And they also show that you don’t have to be great to get hired (my projects were not very good! 😂)
Conclusion
If you were hoping that I would just list out a bunch of projects that you could do… sorry to disappoint.
But I don’t believe that’s helpful.
Every time a new list of projects or a new tutorial comes out, you see tons of people all putting the exact same projects on their resume…
And hiring managers get bored of this FAST.
This article is intended to teach you HOW to build a good project, not just tell you what to build.
And if you follow these steps, and adopt the data analyst mindset, you’ll build a portfolio worthy project that is completely original.
This was a ton of information to cover, and I intend to come back and update this article frequently.
And I know I probably missed some stuff… so if you have ANY questions at all, feel free to leave a comment and I’ll answer as best I can.
Until next time,
Josh


